Rio Rancho, NM Home Sales – Quantifying the trend in graphs.
September 7th, 2010
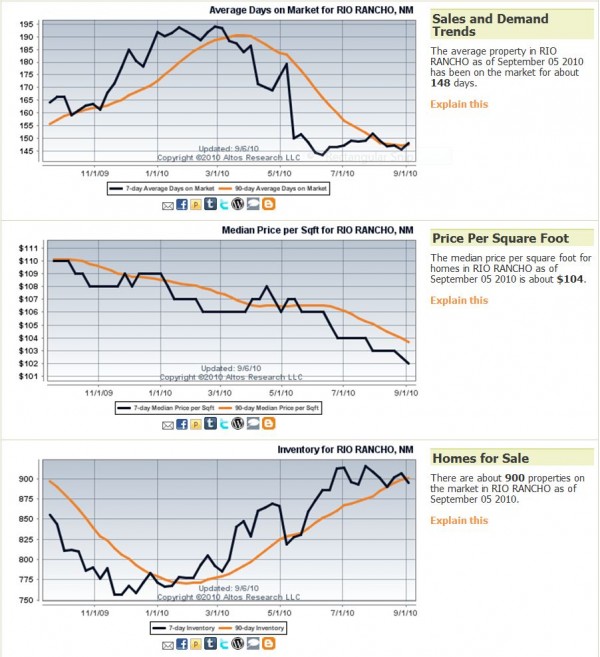
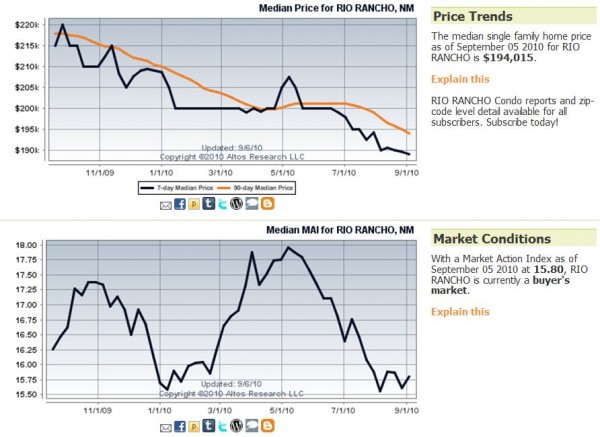
Much time is spent on analyzing and trying to predict the housing market. Below are some home sales statistics for the Rio Rancho, NM housing market compiled by Al-tos Research, a California firm that specializes in housing research for cities all across the U.S. As you see, the median sale price in the Rio Rancho, NM market has been dropping pretty consistently over the last 12 months. Their proprietary Market Activity Index, which combines inventory levels, absorbtion rates, changes in median sale prices and other factors gives a snapshot as to whether the market indicates a “buyer’s market” or a “sellers market’. A number near 30 on their scale, would indicate a market in balance. A lower number, as is currently displayed indicates a definite buyer’s market right now.
The Days on Market chart can actually be deceiving, as it only tracks the time that homes which have sold are staying on the market. Hundreds of homes which never sell at all, are not factored into this statistic. The Price per Square Foot chart is useful, as it mirrors the overall price movement in the market. As you can see in the last chart, the inventory of Rio Rancho, NM homes has moved up since January. Of course, this change influences all of the other graphs, as a higher inventory most often causes downward pressure on prices, and increases the buyer’s market condition.
Al-tos Research offers their statistical services to home buyers and sellers nationwide.

